Novel lead (Pb) record tracing the impact of human policy and culture on Asian pollution emissions in the North Pacific atmosphere over the last 1,600 years
This is the work of Hanna L. Brooks ([email protected]), Michael J. Handley, Karl J. Kreutz, Jacob Chalif, Erich C. Osterberg, Ursula A. Jongebloed, Dominic A. Winski, Liam Kirkpatrick, Bess G. Koffman, Cameron P. Wake, Margit Schwikowski, Emma Skelton, and Dave Ferris.
We acknowledge that Alaska Native peoples have lived on and used the land for thousands of years. Begguya lies at the intersection of the traditional lands of the Ahtna, Dena’ina, Koyukon, Upper Kuskokwim, and Tanana peoples. The Denali Ice Cores were recovered near the summit of Begguya in the Alaska Range, on this ancestral and unceded territory.
This work was completed at the University of Maine. The University of Maine recognizes that it is located on Marsh Island in the homeland of the Penobscot (Panawahpskek) Nation, where issues of water and territorial rights, and encroachment upon sacred sites, are ongoing. Penobscot homeland is connected to the other Wabanaki Tribal Nations — the Passamaquoddy, Maliseet, and Mi’kmaq — through kinship, alliances and diplomacy. The university also recognizes that the Penobscot Nation and the other Wabanaki Tribal Nations are distinct, sovereign, legal and political entities with their own powers of self-governance and self-determination.
Download the Full Resolution poster here:
Why Study Pb in the North Pacific?
Lead (Pb) deposition is typically associated with anthropogenic emissions, and time-series trends can show the influence of human policy, culture, and technology across hundreds to thousands of years. Previous ice core studies have used changes in lead levels through time to examine the effects of industrialization, legislation and worldwide health pandemics. Additionally, Pb isotope ratio data can be used to fingerprint pollution sources, as the U/Th ratio remains fixed during the extraction and processing of raw ore and the subsequent atmospheric transportation of aerosol particles.
Read more in our new publication:
Brooks, H. L., Miner, K. R., Kreutz, K., & Winski, D. A., Accepted. A Global Review of Long-range Transported Lead Concentration and Isotopic Ratio Records in Snow and Ice. Environmental Science: Processes & Impacts.
The North Pacific region (Alaska, USA; Kamchatka Peninsula, Russia) is of particular interest when examining historical trends in pollutants (e.g., lead from gasoline, copper from metal smelting) because its position uniquely links the Asian and North American continents. Previous studies in the North Pacific have been focused on Mt. Wrangell, PR Col (Mt. Logan), the Eclipse Icefield, and Begguya (Mt. Hunter) (Gross et al., 2012). While long Pb concentration records have been published for some of these sites (Osterberg et al., 2008), Pb isotope ratio records have mostly focused on the last 50 years (Koffman et al., 2022; Gross et al., 2012).
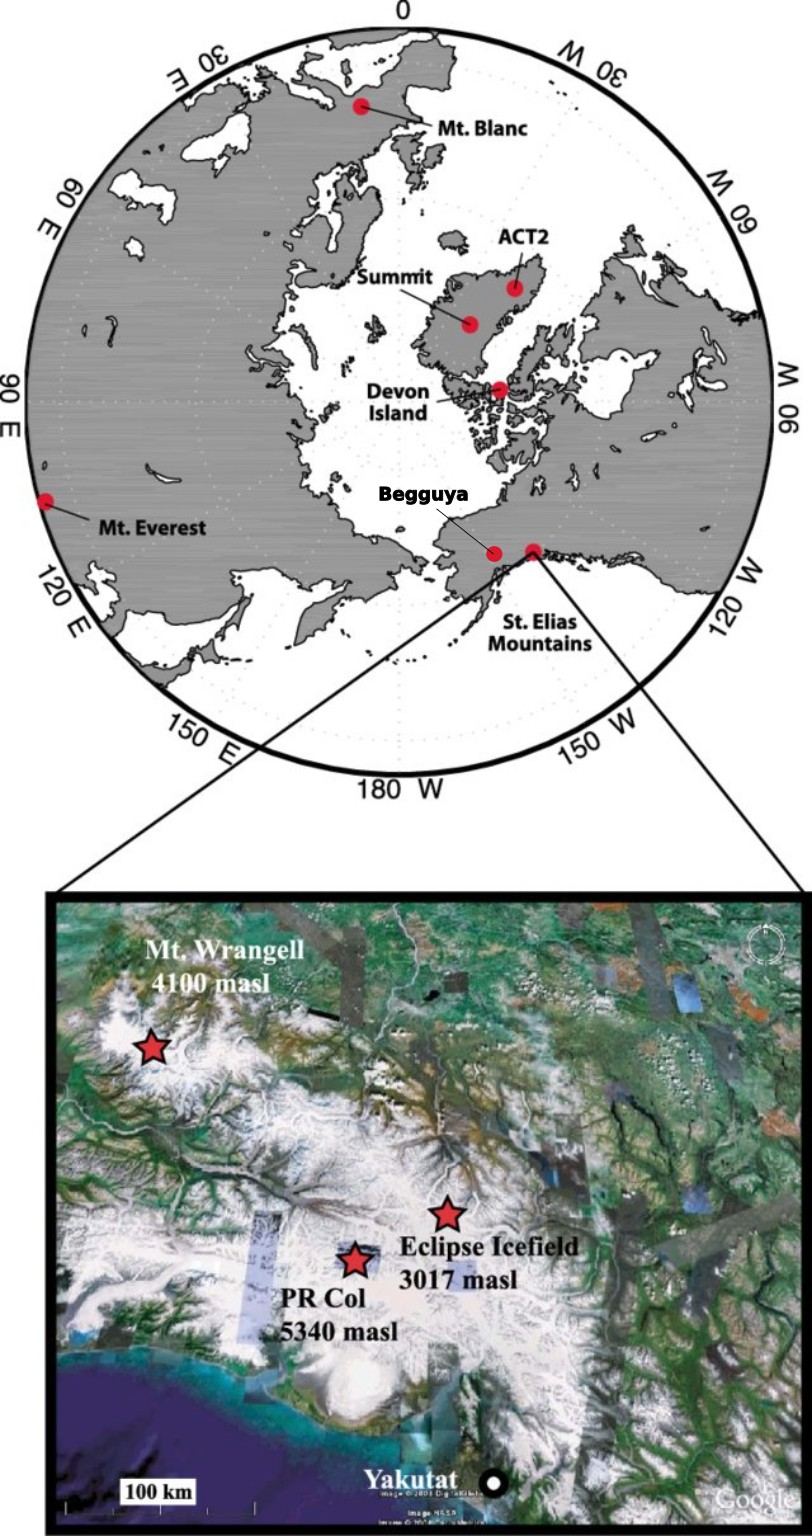
Cryosphere study sites across the North Pacific Region. Figure from Gross et al., 2012.
Pb isotopes can be used to “fingerprint” pollution sources. Each Pb source has a unqiue mixture of the four Pb isotopes – 204, 206, 207, and 208. Critically, the ratio of these isotopes cannot be reset by physical extraction, industrial use, or transport. Therefore, researchers use these known Pb isotope ratios to determine the influence of various Pb sources (i.e. gasoline, ore, coal, dust). Crticially, the prevalance of each Pb source varies over time. In the figure below, we see atmospheric Pb emissions estimates for countries in Asia for: (A) gasoline, (B) coal-burning, (C) smelting of Cu, Ni, Pb, and Zn ores, (D) totals (*excludes minor sources) and (E) emissions strictly from China (Koffman et al., 2022). Over the industrialized period, researchers have recorded a progressive shift toward higher 208Pb/207Pb values recorded in the North Pacific, including (A) 1970s, (B), 1980s, (C), 1990s, and (D) 2000–2001.
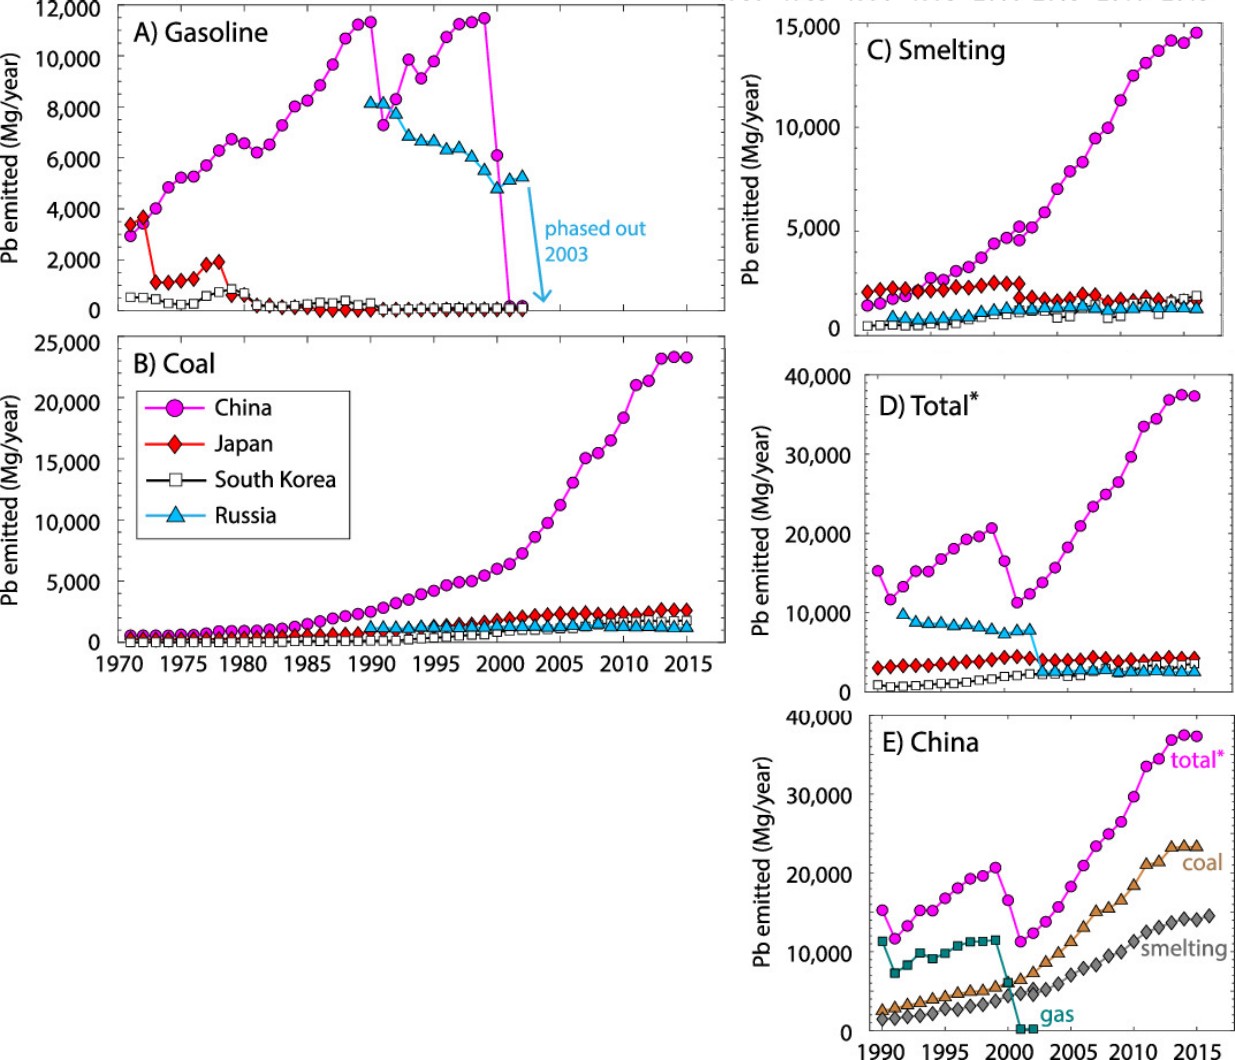
Pb emissions from Asian countries over time. Figure from Koffman et al., 2022.
Here, we seek to evaluate changes in Pb emissions and determine the trends of the pollution source during the global COVID-19 pandemic (2020-2021) by examining Pb deposition on Begguya (Mount Hunter; 62.95 °N, 151.09 °W, 3900 m asl), Alaska. We present a new Pb concentration and isotope record obtained from the DEN-13A, DEN-13B, DEN-19A and DEN-22A spanning from 340 to 2022 CE, allowing us to place recent Pb isotope ratio trends within a longer context.
Methodology
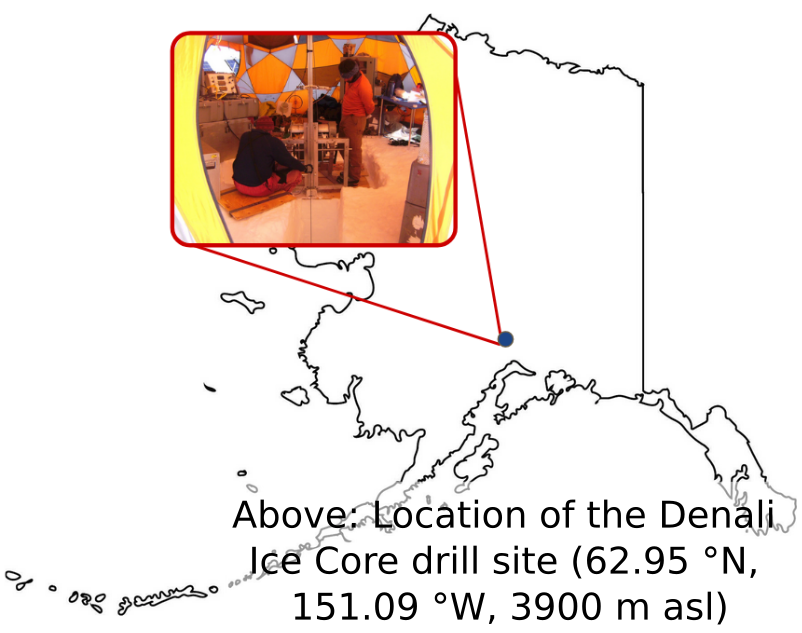
Drill site of the Denali Ice Cores, Begguya (Mt. Hunter), Alaska.
Two parallel surface-to-bedrock ice cores (DEN-13A and DEN-13B) were drilled from the summit plateau of Begguya, Denali National Park, Alaska, during the summer of 2013. The summit of Begguya has previously been shown to have a high accumulation rate and low melt rate (Kelsey et al., 2010, Winski et al., 2018, Winski et al., 2017), making it an ideal site to recover intact paleoclimate records. DEN-13A and DEN-13B, reaching depths of 211.2 and 209.7 meters, respectively, cover at least 10,000 years (Fang et al., 2023, Williams et al., 2023). Shallow cores were drilled in the summers of 2019 (DEN-19A; 50 meters) and 2022 (DEN-22A; 20 meters) extending this paleoclimate record at this site to 2022 CE.
Ice cores contain very low levels of pollutants, such as lead, making it very difficult to accurately detect their levels within the ice particularly when examining ice older than the Industrial Revolution. To reduce contamination, we used the Dartmouth College ice core melter system (Osterberg et al., 2006) and an ultraclean silica carbide (SiC) melthead, the four ice cores (DEN-13A, DEN-13B, DEN-19A, and DEN-22A) were continuously sampled. Four milliliter discrete aliquots from the uncontaminated interior of the ice core were poured from the acid-cleaned primary collection tubes to acid-cleaned polypropylene vials in a HEPA-filtered laminar flow bench to create high resolution samples (Osterberg et al., 2006; Gross et al., 2008). Ultra-pure Optima nitric acid was added to melted samples making a 1% nitric solution.
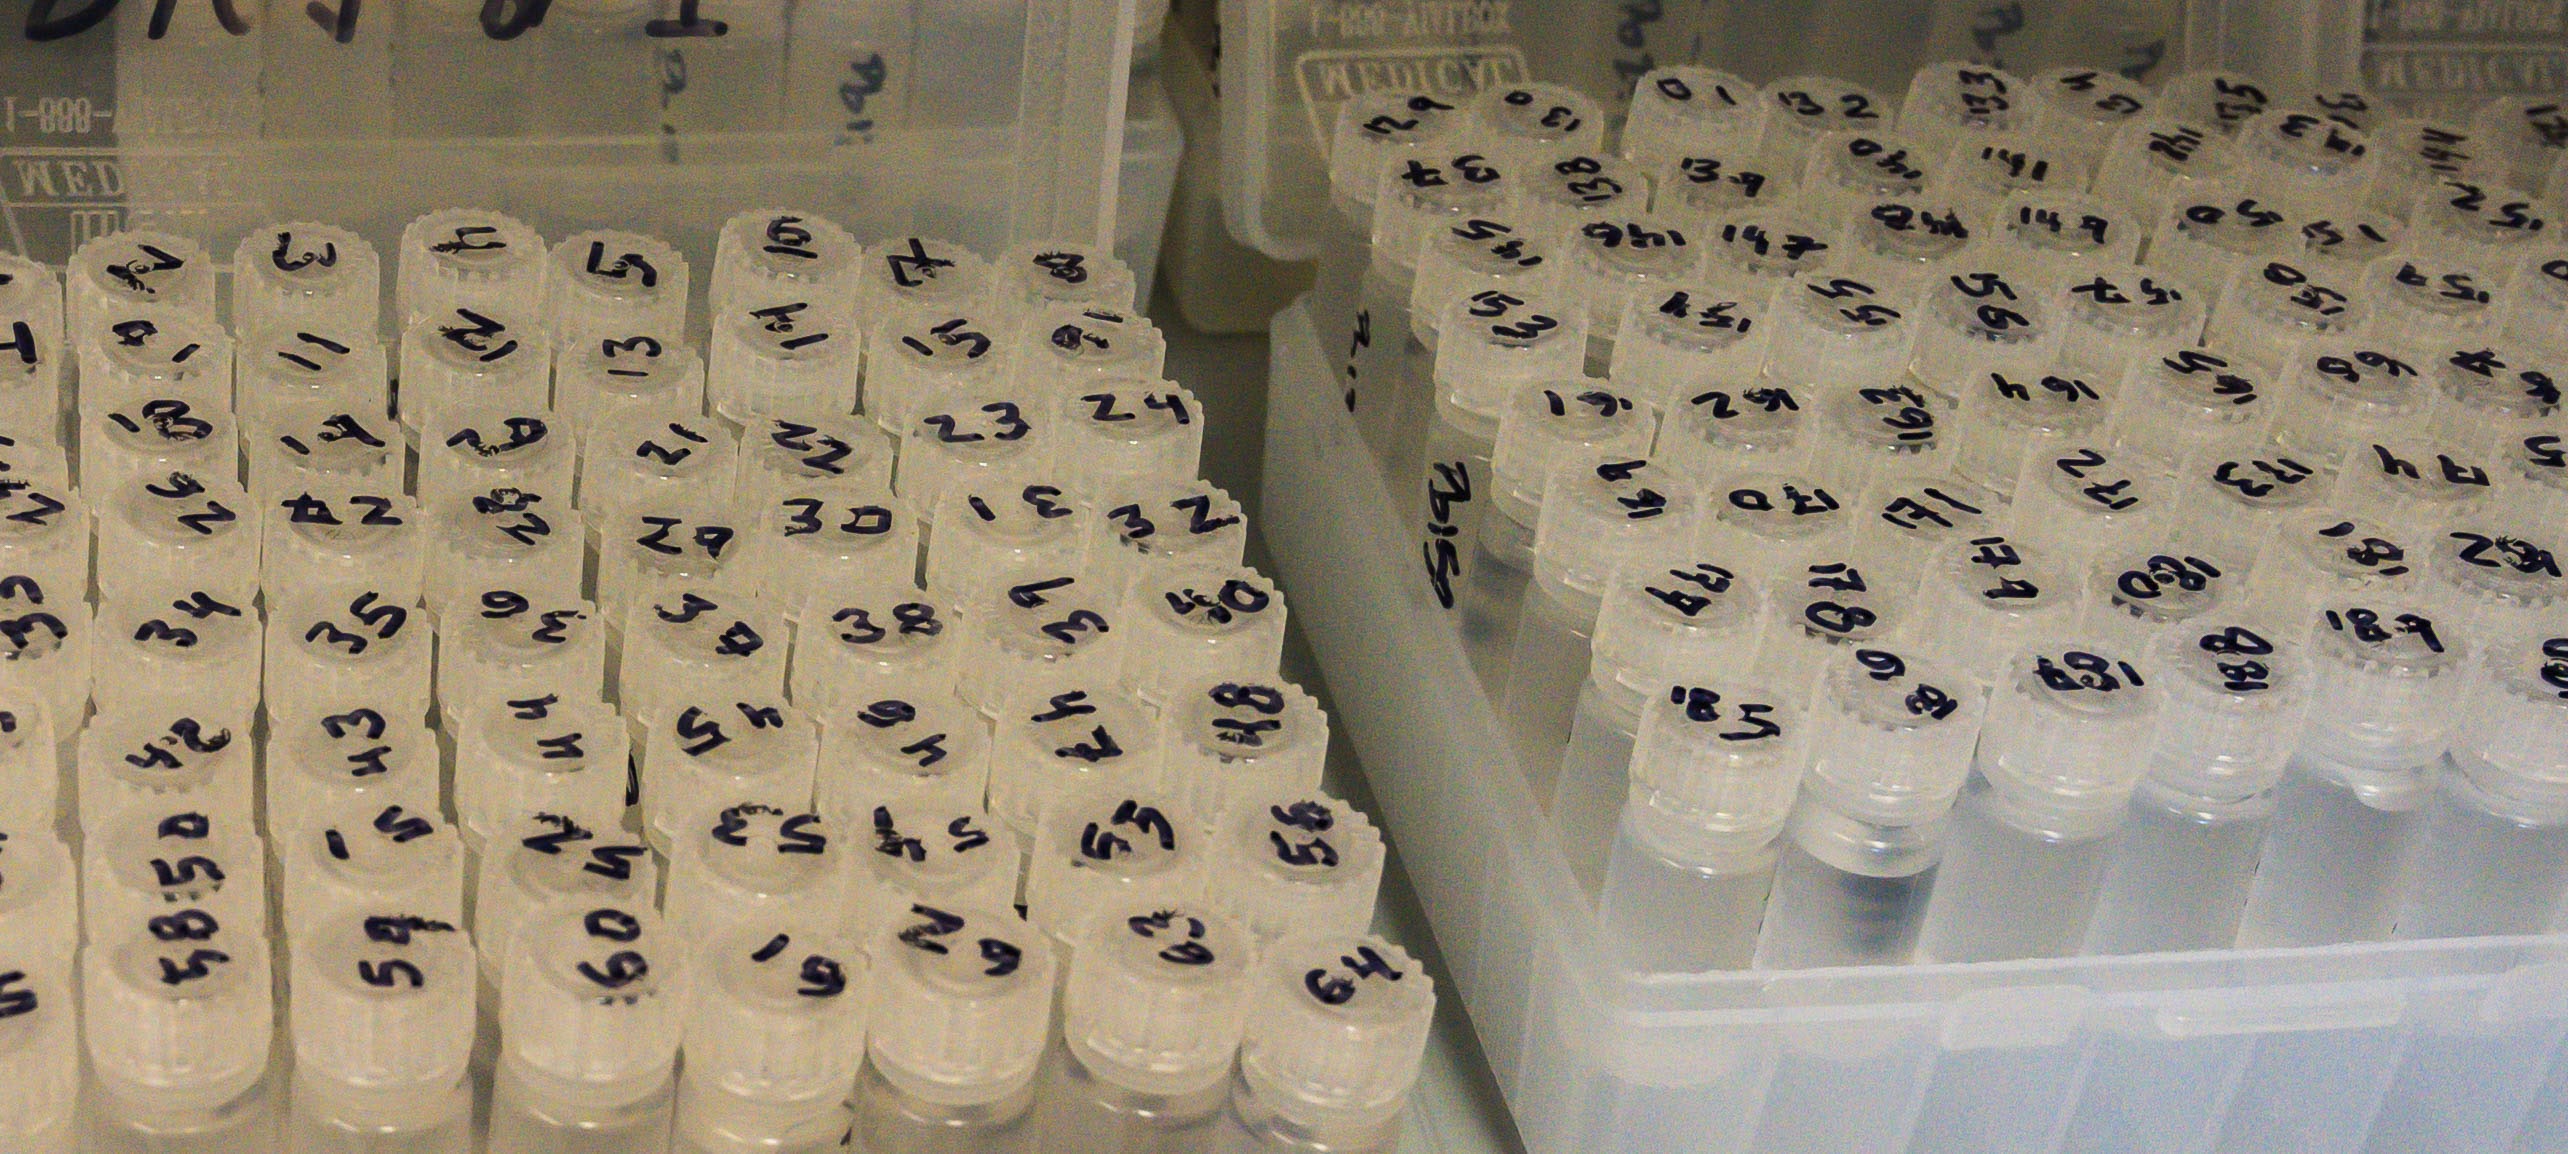 Sample of the Denali Ice Core, preparred for Pb analysis. Photo Credit: Erin Towns.
Pb concentration samples from DEN-13B remained acidified and liquid for 4-6 weeks prior to analysis. These samples were analyzed on the University of Maine Thermo Electron Element2 ICP-MS following the procedure and the detection limits outlined in Osterberg et al. (2006).
Pb concentration (for DEN-19A and DEN-22A) and isotope ratios (for DEN13A, DEN-19A and DEN-22A) samples remained acidified and liquid for 18 months prior to analysis. All Pb measurements were measured in low resolution mode on the University of Maine Thermo Scientific Element XR single-collector high-resolution inductively coupled plasma-sector field mass spectrometer (HR-ICP-MS) equipped with a JET interface, a JET sampler cone and an X skimmer cone to improve sensitivity. We achieved sensitivity of ~70M cps for 1ppb In with a U oxide ratio of 10%.
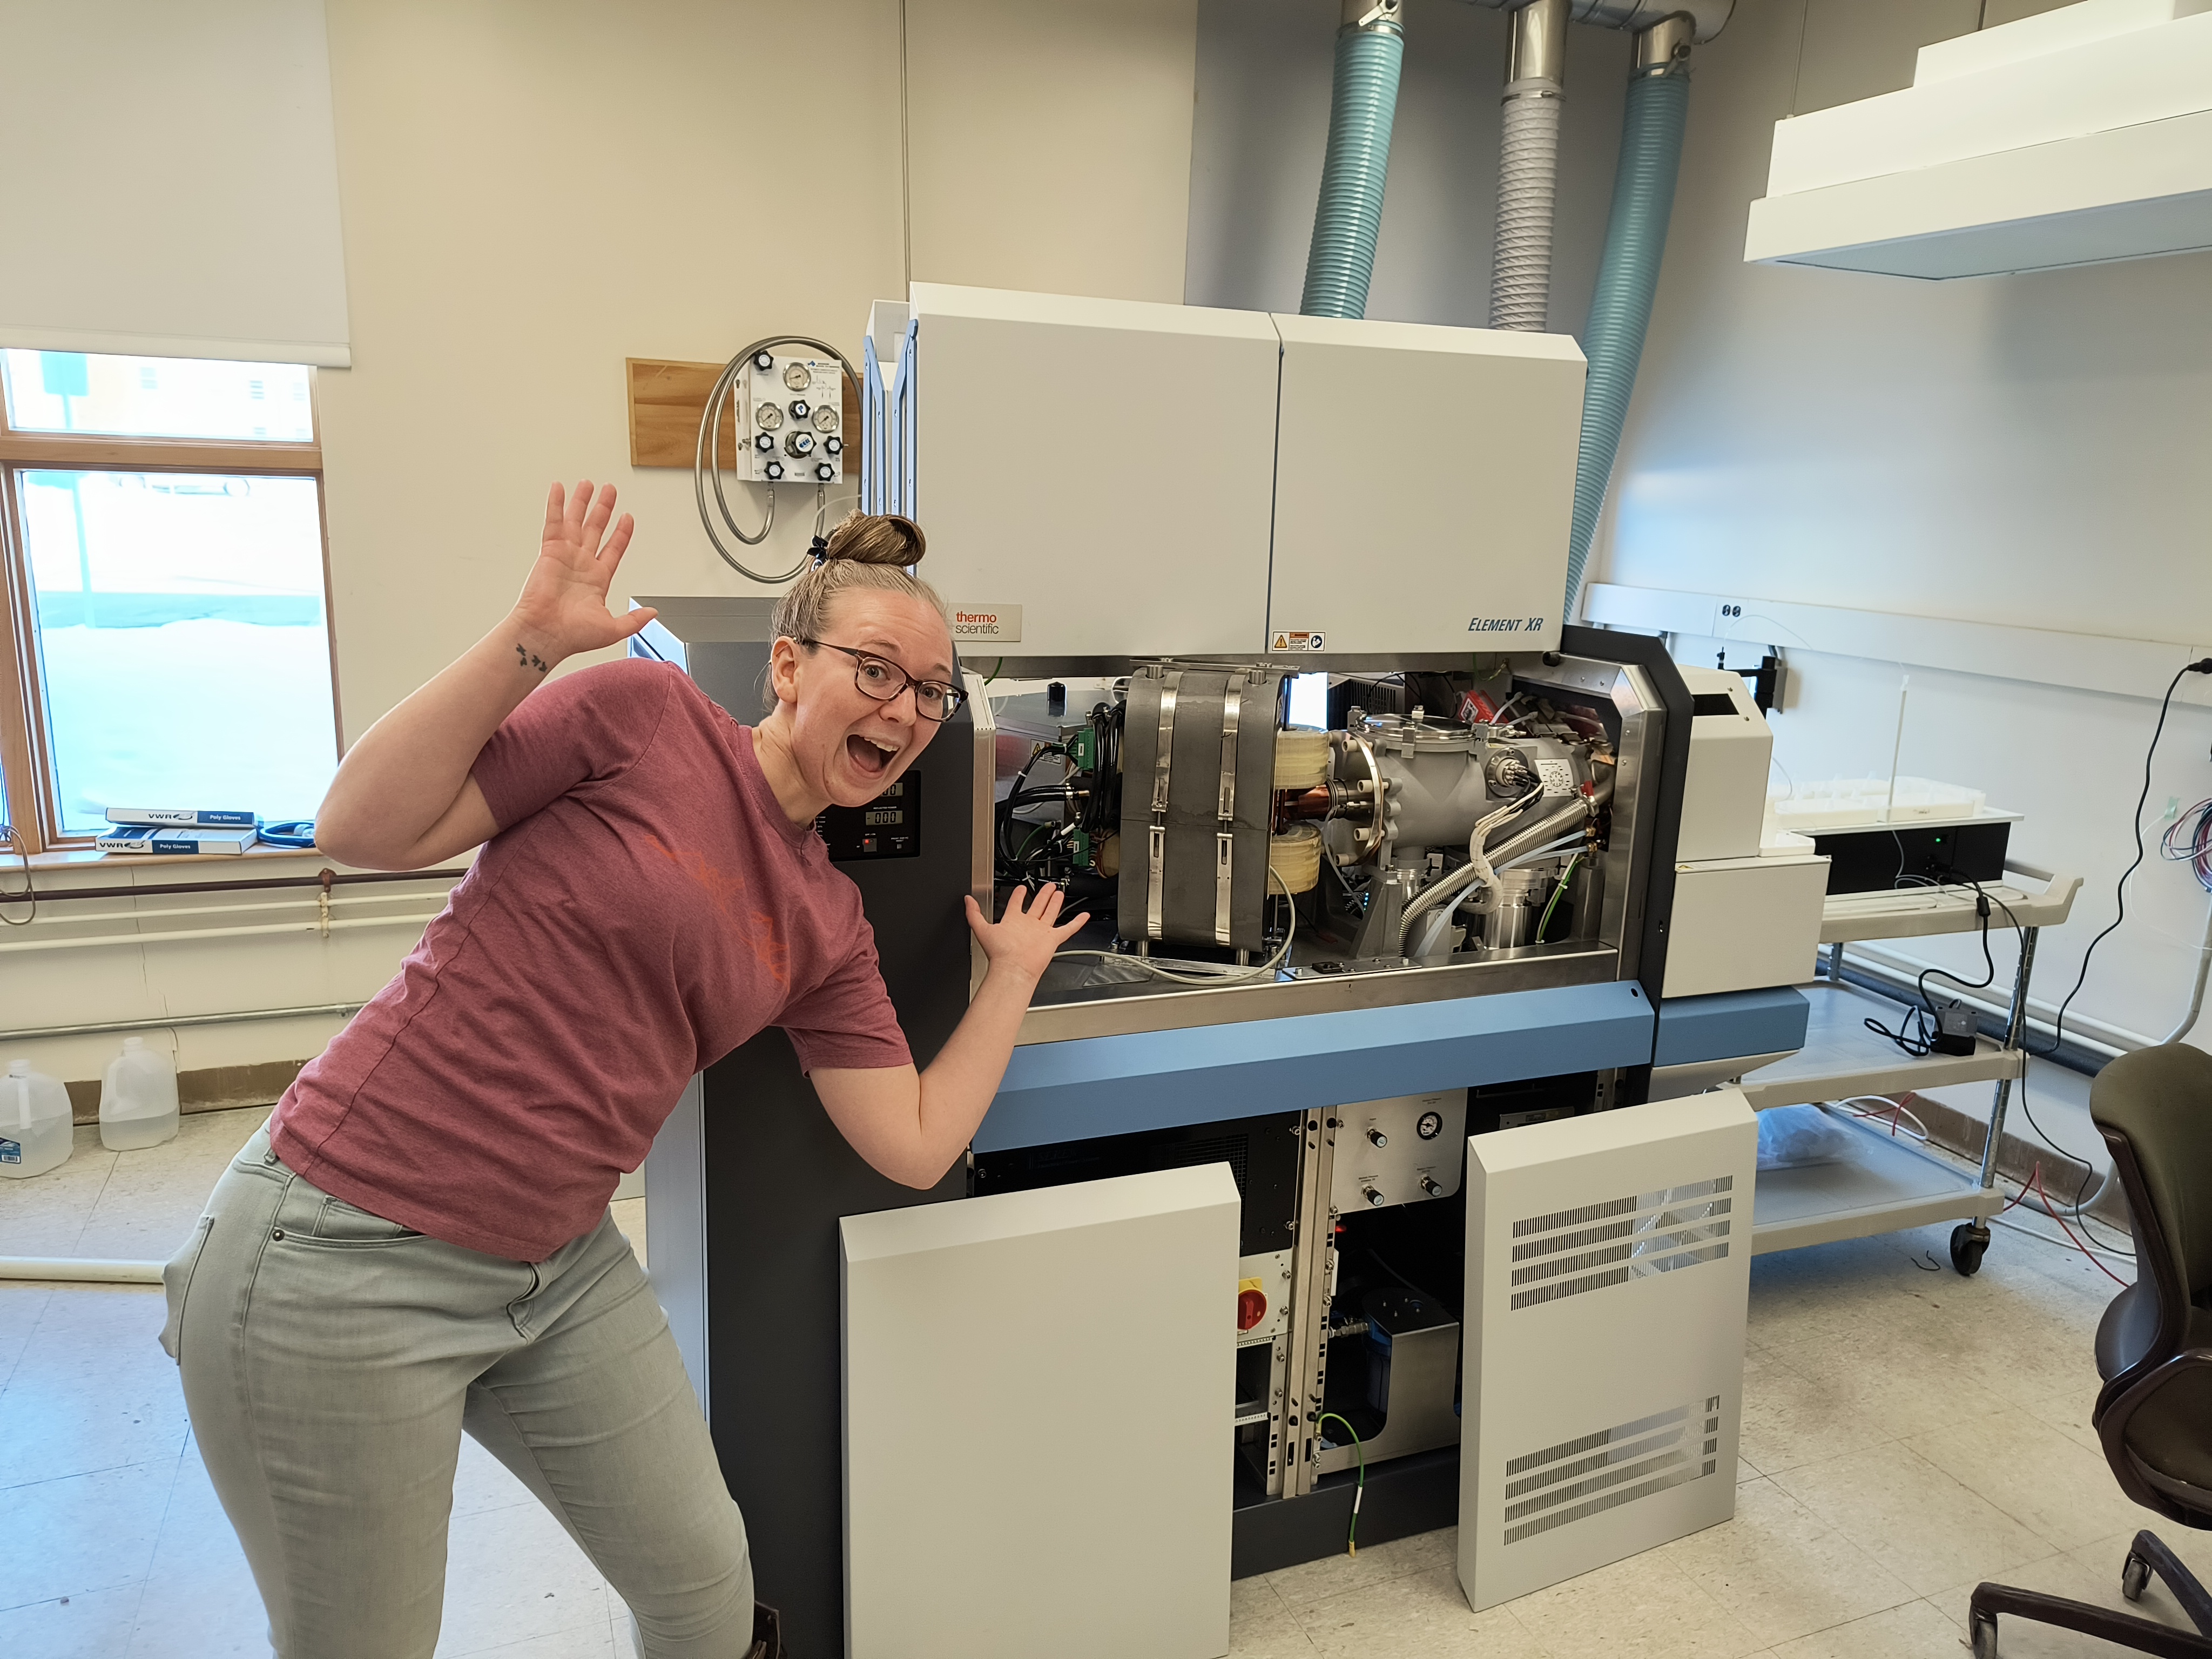 Hanna getting ready to run Denali Ice Core samples on the ICP-MS at the University of Maine. Photo Credit: Mike Handley.
Examining the New Pb Concentration and Isotope Ratio Record
Visual Examination of the Pb Records
Pb concentration data from the Denali Ice Cores shows the same increasing trend seen previously in North Pacific records (Gross et al., 2012; Osterberg et al., 2008). Critically, the Pb concentration differs from trends recorded in the Greenland ice sheets. In Greenland, Pb concentrations recording of the European and American industrial revolutions (1750s – 1840s) with a marked increase in Pb. This increase continues with the addition of tetraethyl Pb into gasoline (1920s). The Pb concentration values decline after ~1970 due to the banning of tetraethyl lead in gasoline and stricter emissions regulations (McConnell et al., 2019). Conversly in the North Paciifc (PR Col, Eclipse Icefield, and Begguya) there is a delay in the increase in Pb concentration. Beginning in the late 1970s, the Pb concentration record increases sharply (~10 to ~100 ng/g), coincident with the industrialization of China over the last 45 years (Wen and Fortier, 2019). Therefore, there is a ~100 year offset between the Pb pollution peaks in Greenland verses the North Pacific.
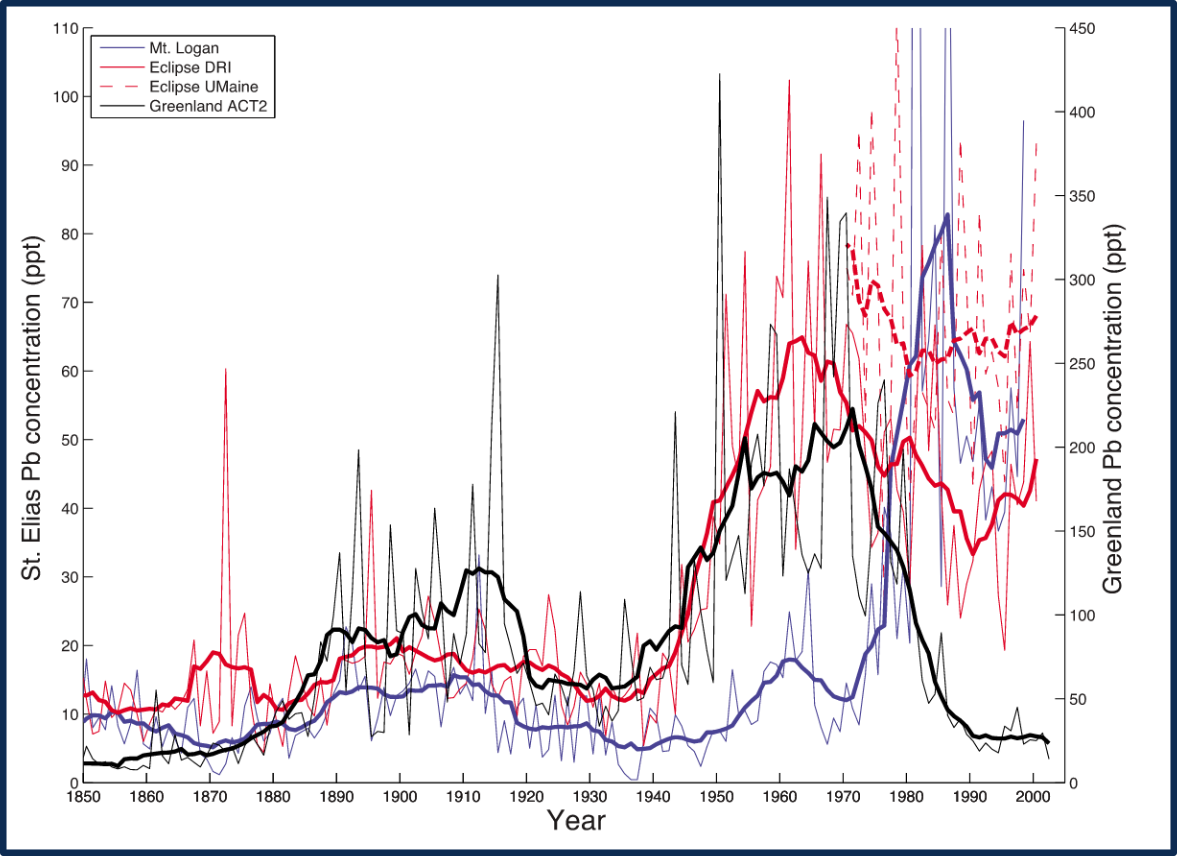 Annual and five-year smoothed Pb concentration data from PR Col and the Eclipse Icefield compared with Greenland (Gross et al., 2012).
 Pb concentration recorded in Begguya (this study, in parts per trillon).
Change Point Detection
We performed a Bayesian irregular change point analysis (Zhao et al., 2019) on the Denali Pb concentration and Pb isotope ratio records to identify significant changes in total pollution deposited and the sources of this pollution, respectively. To prevent high-frequency changes from biasing the changepoint detection algorithm, we performed the changepoint analysis on one-year smoothed records. The change points identified by this method identify points that delimit significant changes in the long-term trend or mean. We allowed the algorithm to detect up to 50 significant change points in the record.
To examine both natural and anthropogenic emission change points, we examined bulk Pb concentration, Pb EFc, and Pb isotope ratio records for change points. Here, we can see the change points associated with total natural (dust + volcanic) Pb emission signal. This shows us places in the record where these natural signals had significant variation, so we do not conflate natural and anthropogenic changes. The results can be seen on the top half of the following figure.
 Results of bayesian change point analysis on total natural EFc (dust + volcanics) Pb concentration and Pb isotope ratios.
Examining the Pb isotope ratio change points allows us to track when a significant change in Pb pollution emission sources occured. Comparing with the EFc record, we see that changes to bulk emissions occasionally align with changes to Pb sources. But more often, they change independantly. Future statistics will be focused on identifying the cause of these change points.
Isotope Ratio Emission Source Detection
Multiclustering
The Pb isotope ratio and Pb concentration records were run through a multiclustering approach (Lüdecke et al., 2020). This approach utilizes supervised and unsupervised clustering methods to determine the best number of clusters to explain a dataset. Examining the Pb isotope ratios, we can see that the data can best be explained with 5 clusters.
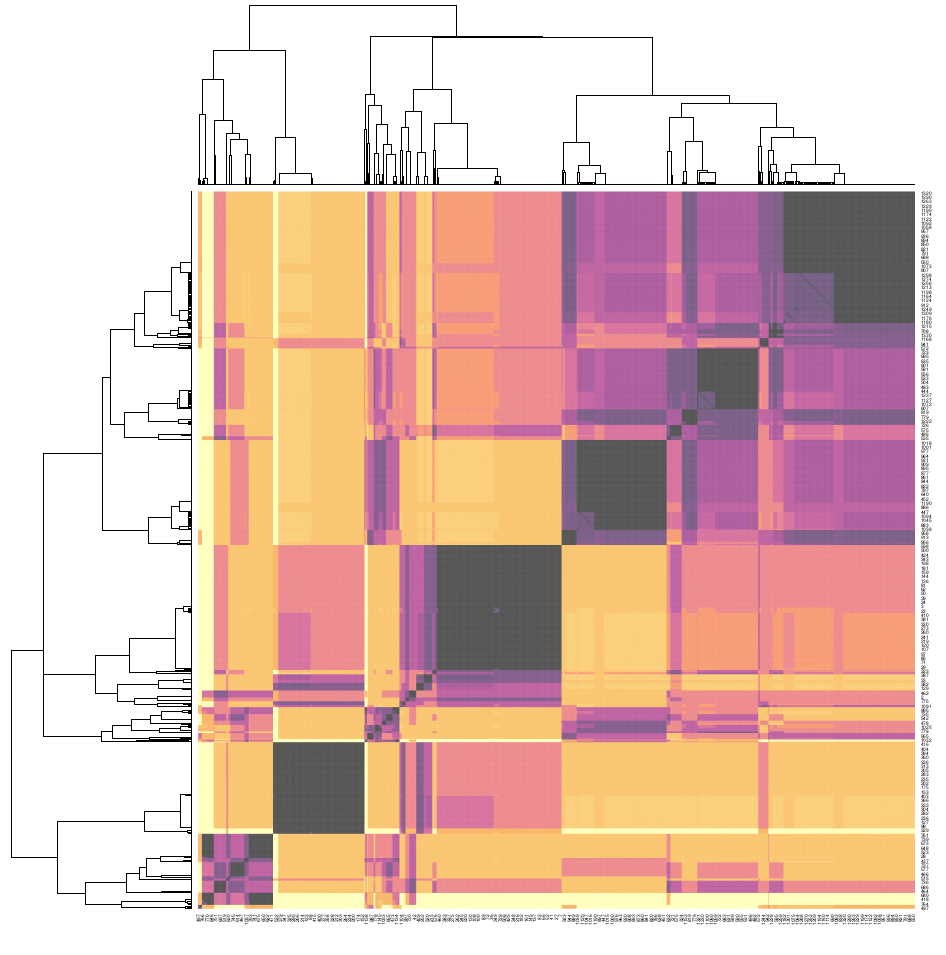 Results of multiclustering on the Denali Ice Core Pb isotope ratio records.
We will use these clustering results to determine Pb emission sources. Each cluster will be independently examined to evaluate the relevant emission sources and mixing of sources which may be occuring in the atmosphere.
Here, we see an initial three isotope plot to begin examining Pb emission sources. The black diamonds represent data from DEN-13A, DEN-19A, DEN-22A, the 2016 Denali snowpit (Koffman et al., 2022), and the 2019 Denali snowpit data (Koffman et al., unpublished). We then added common Pb emission sources from China, including sediment, urban aerosols, coal, fuel, and ore (following the methodology of Sierra-Hernández et al., 2024). Changes in sources can be observed as we move through the dataset. To progress through time in the animation, click on a time of interest on the timeline at the bottom, or click “play”. Data is grouped by decade for easy viewing. The current decade is noted in red text above the timeline. Note that this data analysis is still preliminary.
Isotope Ratio Plots - Animated to Display Data by Decade
Future work will seek to better constrain the sources relevant to the Pb record, and estimate the proportions of different Pb emission sources when they have been mixed in the atmosphere by implementing the MixSAIR model.
Stay tuned for updates!
Acknowledgements and Funding Sources
Work described here is funded by the National Science Foundation (Grant no. AGS-2002483; AGS-1806422; OPP-2002470), the Graduate Student Government at the University of Maine, and two Graduate Maine Space Grant Consortium Fellowships.
We thank Denali National Park, Polar Field Services and Talkeetna Air Taxi for providing air support and field assistance. Special thanks to Inaglise Kindstedt, Emma Skelton, Scott Braddock, Liam Kirkpatrick and Mike Waszkiewicz Brad Markle, Dave Silverstone, Tim Godaire and Elizabeth Burakowski for for ice core drilling and field assistance. We would like to particularly thank the more than 25 students who have worked on the Denali Ice Core Project for their support in the field and the lab. Additionally, we thank the Ice Drilling Program and Ice Core Facility for their support in retrieval and storage of the Denali Ice Cores.
References:
Gross, B. (2008). Lithogenic, Marine and Anthropogenic Aerosols in an Ice Core from the Saint Elias Mountains, Yukon, Canada: Lead-Aerosol Provenance and Seasonal Variability [Masters of Science]. University of Maine.
Gross, B. H., Kreutz, K. J., Osterberg, E. C., McConnell, J. R., Handley, M., Wake, C. P., & Yalcin, K. (2012). Constraining recent lead pollution sources in the north pacific using ice core stable lead isotopes. Journal of Geophysical Research: Atmospheres, 117(D16). https://doi.org/10.1029/2011JD017270
Eichler, A., Tobler, L., Eyrikh, S., Gramlich, G., Malygina, N., Papina, T., & Schwikowski, M. (2012). Three centuries of eastern european and altai lead emissions recorded in a belukha ice core. Environmental Science & Technology, 46(8), 4323–4330. https://doi.org/10.1021/es2039954
Koffman, B. G., Saylor, P., Zhong, R., Sethares, L., Yoder, M. F., Hanschka, L., Methven, T., Cai, Y., Bolge, L., Longman, J., Goldstein, S. L., & Osterberg, E. C. (2022). Provenance of Anthropogenic Pb and Atmospheric Dust to Northwestern North America. Environmental Science & Technology. https://doi.org/10.1021/acs.est.2c03767
Lüdecke, D., Ben-Shachar, M. S., Patil, I., & Makowski, D. (2020). Extracting, computing and exploring the parameters of statistical models using R. Journal of Open Source Software, 5(53), 2445. https://doi.org/10.21105/joss.02445
McConnell, J. R., Chellman, N. J., Wilson, A. I., Stohl, A., Arienzo, M. M., Eckhardt, S., Fritzsche, D., Kipfstuhl, S., Opel, T., Place, P. F., & Steffensen, J. P. (2019). Pervasive arctic lead pollution suggests substantial growth in medieval silver production modulated by plague, climate, and conflict. PNAS, 116(30), 14910–14915. https://doi.org/10.1073/pnas.1904515116
Osterberg, Handley, Sneed, Mayewski, & Kreutz. (2006). Continuous ice core melter system with discrete sampling for major ion, trace element, and stable isotope analyses. Environmental Science & Technology, 40(10), 3355–3361.
Osterberg, E. C., Mayewski, P., Kreutz, K., Fisher, D., Handley, M., Sneed, S., Zdanowicz, C., Zheng, J., Demuth, M., Waskiewicz, M., & Bourgeois, J. (2008). Ice core record of rising lead pollution in the North Pacific atmosphere. Geophysical Research Letters, 35, L05810. https://doi.org/10.1029/2007GL032680
Wen, Y., & Fortier, G. E. (2019). The visible hand: The role of government in China’s long-awaited industrial revolution. Journal of Chinese Economic and Business Studies, 17(1), 9–45. https://doi.org/10.1080/14765284.2019.1582224
Kelsey, E. P., Wake, C. P., Kreutz, K., & Osterberg, E. (2010). Ice layers as an indicator of summer warmth and atmospheric blocking in alaska. Journal of Glaciology, 56(198), 715–722. https://doi.org/10.3189/002214310793146214
Sierra-Hernández, M. R., Marcantonio, F., Griffith, E. M., & Thompson, L. G. (2024). Sources of lead in a Tibetan glacier since the Stone Age. Communications Earth & Environment, 5(1), 548. https://doi.org/10.1038/s43247-024-01724-w
Winski, D., Osterberg, E., Kreutz, K., Wake, C., Ferris, D., Campbell, S., Baum, M., Bailey, A., Birkel, S., Introne, D., & Handley, M. (2018). A 400-year ice core melt layer record of summertime warming in the alaska range. Journal of Geophysical Research: Atmospheres, 123(7), 3594–3611. https://doi.org/10.1002/2017jd027539
Winski, D., Osterberg, E., Ferris, D., Kreutz, K., Wake, C., Campbell, S., Hawley, R., Roy, S., Birkel, S., Introne, D., & Handley, M. (2017). Industrial-age doubling of snow accumulation in the alaska range linked to tropical ocean warming. Scientific Reports, 7(1), Article 1. https://doi.org/10.1038/s41598-017-18022-5
Zhao, K., Wulder, M., Hu, T., Bright, R., Wu, Q., Qin, H., Li, Y., Toman, E., Mallick, B., Zhang, X., & Brown, M. (2019). Detecting change-point, trend, and seasonality in satellite time series data to track abrupt changes and nonlinear dynamics: A Bayesian ensemble algorithm. Remote Sensing of Environment, 232, 111181. https://doi.org/10.1016/j.rse.2019.04.034